


Multifamily Pricing Strategy: A Practical Playbook


The three highest-impact moves in multifamily pricing strategy optimization are running a rule-based pilot on one asset, enforcing a weekly pricing review cadence, and putting simple governance and override rules in place before you scale. That sequence matters. Most operators skip straight to automation and wonder why results disappoint. According to industry research, 54% of operators combine algorithmic recommendations with human oversight, while 31% use a mostly manual approach. No operators reported running fully automated pricing. The point is that no one is running pricing on autopilot, and the operators getting the best results are not trying to.
Here is where to start this week:
Pick one property or one unit type for your pilot. Stabilized assets with at least 12 months of clean lease history work best.
Set 2–3 simple pricing rules tied to occupancy thresholds and days vacant. Write them down. Share them with your team.
Schedule a weekly pricing review. Put it on the calendar. Assign an owner.
Pro Tip: Treat your pricing engine as decision support, not an autopilot. Every recommendation deserves a 60-second gut check against what your onsite team knows.
The Revenue Method, founded by Joani Schumaker, is built on exactly this philosophy: software is a tool, not the strategy. Clean data, clear rules, human oversight, and a consistent review cadence are what make revenue management work.

Table of Contents
What pricing strategies actually work for multifamily portfolios?
Not every portfolio needs the same approach. The right strategy depends on your scale, your data maturity, and how much operational bandwidth your team has.

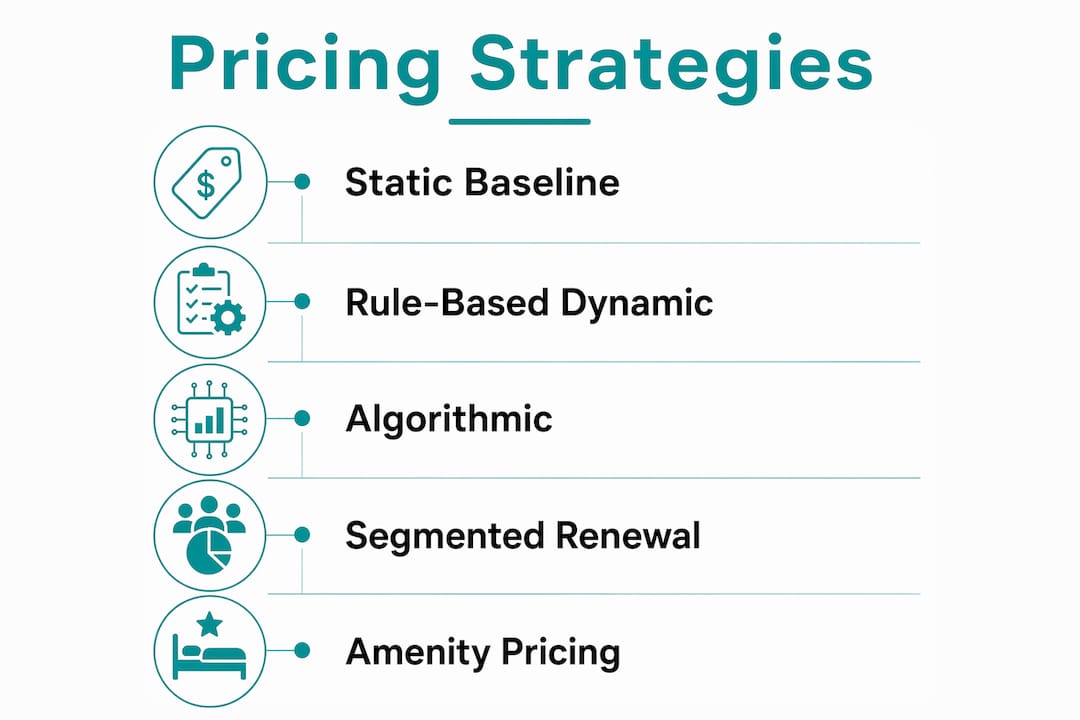
Static baseline pricing
Best for small portfolios (under 100 units) or assets in early lease-up. You set rents based on a comp survey, adjust seasonally, and review monthly. Low overhead, but you will leave money on the table in high-demand periods and react slowly to soft markets.
Rule-based dynamic pricing
The right starting point for growing portfolios moving beyond spreadsheets. You define explicit if/then rules: if occupancy drops below 90%, reduce asking rent by $X; if days vacant exceed 30, trigger a concession. Rules are transparent, auditable, and easy to explain to owners. They do not adapt automatically, so they require regular calibration.
Algorithmic recommendations
Appropriate for stabilized portfolios with clean unit-level data, active comp sets, and a team that reviews outputs weekly. The system surfaces recommendations; your team approves or overrides them. The key word is “recommendations.” Never treat algorithmic output as a final decision.
Segmented renewal pricing
Rather than applying a flat percentage increase across all renewals, you price each renewal based on the resident’s unit type, floor plan, current market rate, and lease expiration timing. This approach protects retention on your most desirable units while recapturing yield where market conditions allow.
Amenity and ancillary pricing
Storage, parking, premium views, and package lockers are separate revenue levers. Most operators underprice them or bundle them invisibly into base rent. Pricing them explicitly, and reviewing them quarterly, adds meaningful revenue without touching base rents. The Revenue Method’s amenity optimization reviews often surface $30–$75 per unit per month in uncaptured amenity revenue.
Example rules by scenario:
Soft market: If occupancy falls below 88% and days vacant exceed 21, offer one month free on a 13-month lease term.
Lease-up: If the property is below 80% occupied, price 3% below the nearest comp and review weekly.
High demand: If occupancy exceeds 96% and leasing velocity is above 4 leases per week, increase asking rent by $25 on the top two floor plans.
Which data signals should you prioritize?
Not all data is worth your time. The signals that move revenue decisions are a short list, and most teams are already sitting on the most important ones.
Priority signals, ranked:
Subject property leasing velocity (leases signed per week, by unit type)
Time on market per unit type (days vacant from available to leased)
Net effective rent (NER) vs. asking rent (the gap tells you what concessions are actually costing)
Comp-set asking rents and active concessions
Upcoming lease expirations by month (your 60–90 day exposure window)
Lead-to-application conversion rate (a drop here signals a pricing or product problem)
Approximately 40% of U.S. apartment units carry some form of concession. If your comp data does not capture concessions and convert them to NER, your pricing model is working from inflated asking rents.
Data freshness matters as much as data type. Unit-level, daily-updated public listing data is more useful than aggregated monthly surveys because it reflects what competitors are actually doing today, not 30 days ago. Public listing data, when collected at sufficient breadth, can be within approximately 0.2% of achieved rents, which is close enough to drive reliable recommendations for most markets.
A small share of market availability, roughly 3–5% of units, is genuinely hidden from automated scraping. Well-trained models account for this by weighting multiple signals rather than relying on any single source. The shadow market signals behind your occupancy and leased trend numbers are worth understanding before you trust any model’s output.
Pro Tip: Capture onsite operational signals in your weekly review: pending renovations, staffing constraints, traffic quality, and known marketing events. These are things the model cannot see.
Signal | Revenue Impact | Ease of Collection |
Leasing velocity | High | Medium |
Days vacant by unit type | High | Easy |
NER vs. asking rent | High | Medium |
Comp-set NER | High | Hard |
Lease expiration exposure | Medium | Easy |
Lead-to-application rate | Medium | Medium |
Why software helps but process wins
The most common mistake operators make when adopting pricing tools is treating the software as the strategy. It is not. The software surfaces recommendations. Your process determines whether those recommendations are good, defensible, and actually implemented.
Setup checklist before you go live
Clean unit-level data: verify floor plan codes, square footage, and unit attributes are consistent across your property management system.
Map floor plans: every unit type needs a canonical label so the system can group and compare correctly.
Standardize concession recording: decide how your team records concessions (dollar amount, months free, rent credit) and apply it consistently.
Connect lease-expiration data: your system needs to see which leases expire when, by unit type, so it can weight recommendations accordingly.
Define your comp set: choose 5–8 direct competitors, verify they are actively leasing, and review the list quarterly.
Common mistakes after go-live
Treating recommendations as automatic approvals without a weekly review
Using stale comp sets that no longer reflect the active market
Recording concessions inconsistently, which distorts NER calculations
Failing to log overrides, so there is no audit trail and no learning loop
The vendor selection process matters too. Before you commit to any platform, require explainability: can the system tell you which factors drove a specific recommendation? If the answer is “the model decided,” that is not good enough. You need to be able to explain every pricing decision to an owner, an investor, or a regulator.
Successful teams cross-check recommendations against local operational realities: traffic quality, delinquency rates, onsite staffing, and planned capital work. The model does not know your HVAC is down on the third floor. Your leasing manager does.
How to run a low-risk pilot in 30–90 days
A rule-based pilot is the right starting point for most portfolios. It limits your exposure, builds team confidence, and generates real data before you commit to a broader rollout.
Pilot timeline
Phase | Timeframe | Key Activities |
Setup | Days 1–14 | Data clean-up, comp set selection, rule definition, baseline metrics |
Dry run | Days 15–30 | Run rules in shadow mode; compare recommendations to actual decisions |
Go-live | — | Implement rules on pilot asset; weekly review cadence begins |
Evaluation | — | Assess KPIs vs. baseline; document overrides; scaling decision |
Sample rules table
Trigger | Condition | Action | Guardrail |
Occupancy drops | Below 90% for 7+ days | Reduce asking rent by $15–$25 | Floor: no lower than 90% of NER baseline |
Days vacant | Unit vacant 21+ days | Add one-month concession | Cap: max 6 weeks free per 12-month lease |
Occupancy rises | Above 96% for 7+ days | Increase asking rent by $25 | Ceiling: no more than 3% above comp-set median |
Lease expiration cluster | 15%+ of leases expiring in one month | Offer 13-month lease term at flat rate | Limit: max 15% of units on 13-month terms |
Metric definitions to track
Occupancy: physical occupancy, measured weekly, by unit type
Net effective rent (NER): asking rent minus amortized concession value
Loss-to-lease: difference between market rent and actual achieved rent
Days vacant: calendar days from unit available to lease signed
Concession spend: total dollar value of concessions granted per month
To decide whether to scale, look for three things: NER holding or improving, days vacant trending down, and override frequency declining as the team builds confidence in the rules.
How should you structure governance and overrides?
Governance has become a competitive advantage in multifamily pricing. Operators who document their rationale, require approvals, and treat recommendations as decision support are better positioned for regulatory scrutiny and owner reporting.
Approval matrix
Decision Type | Who Can Approve | Escalation Trigger |
Pricing within defined bands | Leasing manager | None |
Override within 5% of band | Regional manager | None |
Override exceeding 5% of band | Asset manager or owner | Required documentation |
New pricing rule or band change | Revenue manager + owner | Written rationale required |
Override documentation template
Every override should capture: the reason for the override, a snapshot of the data at the time of the decision, the name of the approver, and the expected duration. Archive these records. They are your audit trail.
When overrides are appropriate:
Pending renovation or known unit defect not yet reflected in the system
Major amenity outage (pool, gym, elevator) affecting leasing appeal
Known marketing event or competitor opening that will shift demand temporarily
Staffing constraint that limits leasing capacity
When overrides are not appropriate:
“I think the market is softer” without supporting data
Pressure from a prospect to match a price the comp set does not support
Avoiding a difficult conversation with a resident about a renewal increase
Overrides are not a failure of the pricing system. They are a necessary tool when local knowledge exposes risks the data misses.
Pro Tip: Log every override and review them monthly. Patterns in your override log tell you where your rules need recalibration or where your data has a blind spot.
How do you price renewals and manage lease-expiration clusters?
Renewals are where most operators leave the most money on the table, and where poor timing creates the most self-competition. A resident who does not renew costs you turnover, vacancy days, and remarketing spend. A renewal priced too low costs you yield. The goal is to find the number that keeps the resident and reflects the market.
Renewal offer mechanics
Pull the current market rate for the unit type (NER, not asking rent).
Calculate the net-effective economics of the current lease (what the resident is actually paying after any original concessions).
Offer a renewal rate that closes the gap between current NER and market NER, phased over one or two renewal cycles if the gap is large.
For residents in your highest-demand unit types, prioritize retention with a modest increase. For residents in lower-demand units, price closer to market.
Timing checklist to manage expiration clusters
Review your lease expiration calendar 90 days out, every month.
If more than 15% of your leases expire in a single month, offer 13-month or 14-month lease terms to stagger the next cycle.
Send renewal offers 60–90 days before expiration, not 30 days.
Track renewal acceptance rates by unit type and by offer amount.
Concession logic for renewals
Amortize any original move-in concession across the lease term to compute the resident’s true NER. Use that figure, not the asking rent, when calculating the renewal increase. A resident who received two months free on a 12-month lease is paying roughly 83% of the asking rent. Their renewal offer should reflect that baseline, not the full asking rent.
Pro Tip: A timely renewal conversation, even with a small concession, almost always costs less than a vacancy plus remarketing. Run the math before you hold firm on a number.
For student housing portfolios, renewal strategy requires additional timing discipline. Most student leases turn on academic calendars, which means expiration clusters are structural, not accidental. Offering early-bird renewal incentives in October for the following August lease cycle is a proven approach to student housing renewal strategy best practices.
What KPIs should you track and how often?
KPI definitions
KPI | Definition | Review Cadence |
Revenue per available unit (RevPAU) | Total collected revenue divided by total units (occupied and vacant) | Weekly |
Net effective rent (NER) | Asking rent minus amortized concession value | Weekly |
Loss-to-lease | Market rent minus achieved rent, expressed as a dollar or percentage gap | Monthly |
Days vacant | Calendar days from unit available to lease signed | Weekly |
Lead-to-application conversion | Applications divided by total leads, by unit type | Weekly |
Renewal retention rate | Renewals signed divided by total leases expiring | Monthly |
Reporting cadence
Weekly tactical report: occupancy, NER, days vacant, leasing velocity, and override log. Reviewed by the revenue manager and regional team.
Monthly performance summary: RevPAU trend, loss-to-lease, concession spend, and renewal retention. Reviewed with asset managers.
Quarterly strategic review: full KPI set, comp-set analysis, pricing band review, and pilot scaling decision. Presented to owners.
Your revenue forecast accuracy depends on how consistently you track these numbers and how quickly you connect KPI changes to specific pricing actions. When NER drops and days vacant rise simultaneously, that is a pricing signal. When NER holds but conversion drops, that is a product or marketing signal. The distinction matters for the response.
What does a real pilot look like in practice?
Here is an anonymized example from a 120-unit stabilized community that ran a 90-day rule-based pilot.
Before the pilot: Occupancy was at 87%, average days vacant was 34, and the team was offering concessions inconsistently with no standard recording process. NER was approximately 6% below asking rent, but the team did not know it because concessions were not being tracked at the unit level.
Pilot setup: The team standardized concession recording, defined three pricing rules (occupancy trigger, days-vacant trigger, and a high-demand ceiling), and committed to a weekly review. No new software was added. The rules ran on a shared tracking sheet reviewed every Monday.
After 90 days: Occupancy moved to 93%, average days vacant dropped to 22, and the team had a clear picture of NER for the first time. Concession spend decreased because the rules targeted concessions to specific unit types rather than applying them across the board.
Replicable rule set
Rule | Trigger | Action | Guardrail |
Occupancy floor | Occupancy below 90% | Reduce asking rent by $25 | Floor: 90% of prior NER |
Vacancy ceiling | Unit vacant 21+ days | Offer one month free on 13-month term | Max 5% of units on concession at once |
Demand ceiling | Occupancy above 96% | Increase asking rent by $25 | Cap: 3% above comp-set NER median |
Lessons learned
Data cleanliness was the hardest part. Two weeks of cleanup before go-live paid for itself in better decisions.
Onsite team buy-in required explaining the rules, not just announcing them. Weekly reviews became a team ritual, not a management audit.
Overrides happened most often in weeks 2–4. By week 8, the team trusted the rules and overrides dropped significantly.
Scaling to a second property was straightforward because the documentation was already in place.
What mistakes do operators make most often?
Do’s and don’ts
Do:
Log every override with a reason and an approver
Review your comp set quarterly and remove properties that are no longer direct competitors
Calculate NER, not just asking rent, for every pricing decision
Train your leasing team on how to explain pricing decisions to prospects
Don’t:
Let the pricing engine run without a weekly human review
Apply flat percentage increases to all renewals without checking market rates
Use a comp set that has not been validated in the past 90 days
Assume the model knows about your pending renovation or amenity outage
Operational readiness checklist before scaling
Unit-level data is clean and consistent across all properties
Concession recording is standardized and enforced
Weekly review cadence is established and attended
Override documentation template is in use
Comp set is validated and current
Leasing team understands the rules and can explain them
Quick remediation steps when something goes wrong:
If occupancy drops sharply: implement a temporary floor rate and review the comp set immediately.
If concession spend spikes: audit override logs for patterns and retighten the concession guardrail.
If the team stops trusting the rules: go back to weekly reviews and walk through two or three recent recommendations together.
How do economic factors affect your pricing decisions?
Interest rates, employment trends, and local supply conditions are not background noise. They are inputs that should shape your pricing posture at the portfolio level, even when your rules operate at the unit level.
When interest rates rise, homeownership becomes less accessible and rental demand typically strengthens, particularly in markets with strong employment. That dynamic supports firmer pricing and fewer concessions. When rates fall and for-sale inventory loosens, some of your residents will leave for ownership, and your renewal strategy needs to account for that churn risk.
Employment trends matter at the submarket level. A market adding jobs in sectors that attract your resident profile (tech, healthcare, professional services) supports rent growth. A market with layoffs or employer relocations signals softening demand before your occupancy numbers show it. Track local employment data monthly and factor it into your quarterly pricing review.
New supply is the variable most operators underestimate. A new 300-unit lease-up two miles away will affect your concession environment within 60 days of opening, even if your occupancy has not moved yet. Monitor permitted and under-construction units in your submarket and adjust your pricing posture before the competition arrives, not after.
What legal and regulatory considerations affect pricing?
Algorithmic pricing in multifamily has attracted significant regulatory attention. The U.S. Department of Justice filed a civil antitrust lawsuit related to algorithmic pricing coordination in 2024, and additional litigation by state Attorneys General against other pricing software providers remains ongoing. The core legal concern is whether shared use of the same pricing software, combined with shared competitor data, constitutes price coordination under the Sherman Act.
The practical implication for operators is straightforward: understand what data your pricing tool uses and where it comes from. If the system uses competitors’ nonpublic lease transaction data, that carries legal risk. Public listing data, by contrast, is generally considered acceptable. Legal risk centers on the use of competitors’ nonpublic data; practical risks include vacancy exposure from aggressive pricing and poor input data quality.
Rent control and rent stabilization laws vary significantly by state and municipality. New York, California, Oregon, and several cities in other states have active rent stabilization frameworks that cap annual increases for covered units. If any of your assets are in covered jurisdictions, your pricing rules must incorporate those caps as hard guardrails, not soft suggestions.
Fair housing compliance is a separate but equally important consideration. Pricing decisions must not produce discriminatory outcomes by race, national origin, familial status, or other protected classes, even when those decisions are generated by an algorithm. Document your pricing rationale and review outcomes by resident demographic periodically.
This article is general information, not legal advice. Confirm current regulations with a qualified attorney for your specific portfolio and jurisdiction.
How do you segment pricing by tenant profile?
Not all residents respond to the same pricing signals, and not all unit types attract the same resident profile. Segmentation lets you price more precisely without applying blanket increases that hurt retention in your most valuable segments.
Practical segmentation approaches:
By unit type: Studio and one-bedroom residents are often more price-sensitive and more likely to move. Two- and three-bedroom residents tend to have higher switching costs (moving costs, school districts, family logistics) and can absorb moderate increases without churning.
By lease term: Residents who sign longer leases represent lower turnover risk. Pricing a 14-month lease slightly below a 12-month lease is a reasonable trade-off for the operational stability it provides.
By resident tenure: Long-term residents (3+ years) have demonstrated loyalty. Aggressive renewal increases on this segment often produce churn that costs more than the yield gained.
By property type: Student housing, build-to-rent, and conventional multifamily each have distinct demand drivers. Student housing turns on academic calendars and parental income; build-to-rent attracts residents who want single-family living without ownership; conventional multifamily serves the broadest range of income levels and life stages.
The goal of segmentation is not to charge different residents different prices for the same unit. It is to recognize that different unit types, lease structures, and resident profiles have different price elasticities, and to price accordingly.
How do marketing and leasing connect to pricing?
Pricing does not exist in isolation. Your asking rent is only as effective as the marketing that delivers it to the right prospect and the leasing process that converts that prospect into a signed lease. When those three functions are misaligned, you get pricing that looks right on paper but underperforms in practice.
A common misalignment: the pricing team sets a rate, but the leasing team is trained to lead with concessions before the prospect even asks. The result is that your NER is lower than your pricing model assumes, and your comp set sees your concessions and adjusts their own pricing accordingly.
Aligning leasing scripts with pricing recommendations is a practical fix. Train your team to present the asking rent first, explain the value, and offer a concession only when the prospect has a specific objection. Track how often concessions are offered proactively versus reactively. That ratio tells you a lot about where your leasing process is undermining your pricing strategy.
Marketing channel performance also feeds pricing decisions. If your highest-converting leads come from a specific source, and that source is delivering prospects for a particular unit type, that is a demand signal worth weighting in your weekly review. Pricing and marketing should share data, not operate in separate reporting silos.
How do you manage pricing risk and run sensitivity analysis?
Every pricing decision carries two risks: pricing too high (vacancy) and pricing too low (yield loss). Sensitivity analysis helps you understand how much either direction costs before you commit.
A simple sensitivity framework:
Vacancy risk: If you raise asking rent by $50 and it adds 7 days to your average days vacant, what does that cost in lost rent? Compare that to the annual yield gain from the higher rate.
Concession risk: If you offer one month free to close a lease faster, what is the NER impact over the lease term? Is that better or worse than holding the rate and waiting?
Renewal risk: If you push a renewal increase above what the market supports, what is the probability the resident does not renew? Multiply that probability by your estimated turnover cost (vacancy days, make-ready, leasing commission) to get the expected cost of the increase.
Property management’s role in maximizing returns includes exactly this kind of operational risk framing. Pricing decisions that look good in isolation often look different when you account for the full cost of the outcome they produce.
Build a simple sensitivity table into your monthly reporting. Three columns: scenario (hold rate, reduce $25, increase $25), expected days vacant, and expected NER over 12 months. That table forces the conversation from “what should we charge?” to “what are we willing to risk?”
Key Takeaways
Effective multifamily pricing strategy optimization requires a rule-based pilot, a consistent weekly review cadence, and governance that makes every pricing decision explainable and defensible.
Point | Details |
Start with a rule-based pilot | Choose one asset, define 2–3 occupancy-based rules, and run for 30–90 days before scaling. |
NER over asking rent | Approximately 40% of U.S. units carry concessions; always calculate net effective rent to avoid biased decisions. |
Governance is non-negotiable | Document every override with a reason, approver, and expected duration to build an audit trail and learning loop. |
Weekly review cadence | Assign a named owner for the weekly pricing review; without accountability, recommendations go unexamined. |
The Revenue Method | Provides independent advisory, pilot design, governance setup, and amenity pricing reviews for U.S. multifamily portfolios. |
The case for explainability over optimization
There is a version of multifamily pricing that looks impressive in a vendor demo and falls apart in the field. The model runs, the recommendations come out, and the leasing team either ignores them or follows them blindly. Neither outcome is good.
What actually works is a system your team understands well enough to question. When a recommendation comes in that does not match what the leasing manager is seeing on the ground, that tension is valuable. It either means the model is missing something (a pending renovation, a competitor opening, a staffing gap) or the leasing manager’s intuition is wrong and the data is right. Either way, the conversation produces a better decision than either party would have made alone.
The operators I see getting consistent results are not the ones with the most sophisticated tools. They are the ones who have built a weekly ritual around reviewing recommendations, logging overrides, and asking “why did the model say that?” That discipline compounds over time. Your override log becomes a training set. Your weekly reviews surface patterns. Your team gets better at knowing when to trust the model and when to push back.
Governance, in this context, is not bureaucracy. It is the mechanism that turns a pricing tool into a pricing system. And a pricing system, maintained consistently, is what protects your NOI when the market gets complicated.
Work with The Revenue Method on your next pricing pilot
If you are ready to move from spreadsheets and gut feel to a structured, defensible pricing approach, The Revenue Method offers fractional revenue management support, pilot design and implementation, governance setup, and amenity pricing reviews for U.S. multifamily portfolios. The engagement is independent of any software vendor, which means the advice is built around your asset strategy, not a platform’s sales cycle.

The Revenue Method works with apartment owners, asset managers, and operators who want to get pricing right before they scale it. Whether you need help designing your first pilot, cleaning up a system that is already in place, or building the governance framework your investors are asking for, the starting point is a scoping conversation. Visit The Revenue Method to learn more about how the advisory engagements work, or go straight to scheduling a conversation to talk through your portfolio’s specific situation.
Recommended


Comments