


Multifamily Cap Rate Revenue Connection: 2026 Guide


The multifamily cap rate is defined as a property’s net operating income (NOI) divided by its current market value, and this single ratio is the direct link between revenue performance and asset valuation. Every dollar of NOI you add or lose moves your property’s value by a multiplier equal to the inverse of the cap rate. The multifamily cap rate revenue connection is not theoretical. It is the formula that drives acquisition pricing, exit modeling, and operational strategy across every asset class. Industry benchmarks from CBRE and MRI Software place multifamily cap rates in the 4%–10% range, with institutional core assets trading closer to the lower end.
How does NOI drive multifamily property value through cap rates?
The formula is straightforward: Property Value = NOI ÷ Cap Rate. What makes it powerful is the multiplier effect hidden inside it. At a 5% cap rate, every $10,000 increase in annual NOI adds $200,000 in value. At a 6% cap rate, that same $10,000 adds roughly $166,667. At 7%, it adds $142,857. The cap rate you are operating under determines how much each dollar of revenue improvement is worth at exit.
This multiplier logic is why operators who treat revenue management as a cost center are leaving real money on the table. A $40,000 annual improvement in NOI at a 6% cap rate translates to approximately $667,000 in additional property value. That is not a rounding error. That is a material change in your equity position.

The table below shows the value impact of a $10,000 NOI increase across three common cap rate scenarios.
Cap Rate | NOI Increase | Value Added |
5% | $10,000 | $200,000 |
6% | $10,000 | $166,667 |
7% | $10,000 | $142,857 |
The operational levers that move NOI include rent optimization, ancillary income, expense control, and expense recovery programs like RUBS (Ratio Utility Billing System) and CAM reconciliations. Revenue management and operational excellence multiply NOI and drive asset appreciation. The cap rate is the amplifier. NOI is what you control.
Pro Tip: Before you model an acquisition, calculate the NOI improvement required to justify your purchase price at your target exit cap rate. If the operations cannot realistically deliver that improvement, the deal does not pencil.
What does a good multifamily cap rate look like in 2026?
Cap rates do not exist in a vacuum. They reflect risk, market conditions, asset quality, and investor appetite. Multifamily cap rates stabilized in the mid-5% range in Q1 2026 after expanding significantly from the sub-3% levels seen in early 2022. Institutional core assets are trading near 4.75%, while Sun Belt and value-add assets are running 50–100 basis points wider.
Lower cap rates signal lower perceived risk and typically reflect stable, high-demand markets like New York City, Boston, or San Francisco. Higher cap rates reflect higher risk and higher return potential, which is the profile you see in secondary markets and value-add plays. Neither is inherently better. The right cap rate depends on your investment thesis.
Asset type also drives significant variation. Garden-style communities in suburban markets generally carry higher cap rates than mid-rise or high-rise assets in urban cores, reflecting both construction cost differences and demand dynamics.
Asset Type | Typical Cap Rate Range (2026) | Market Profile |
Institutional core (urban high-rise) | 4.50%–5.25% | Gateway markets, low risk |
Mid-rise suburban | 5.25%–6.25% | Secondary markets, moderate risk |
Garden-style value-add | 6.00%–7.50% | Sun Belt, tertiary markets |
High-risk or distressed | 7.50%–10%+ | Turnaround plays, execution risk |
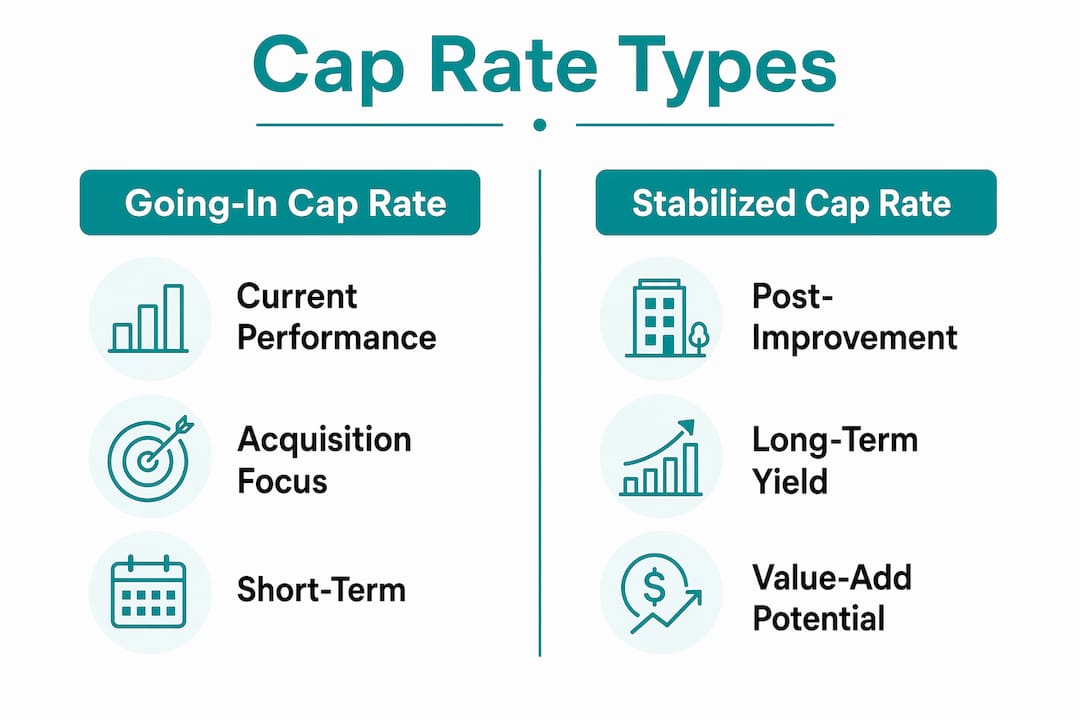
One distinction that gets overlooked in acquisition underwriting is the difference between going-in and stabilized cap rates. The going-in cap rate reflects current performance, capturing existing occupancy and revenue. The stabilized cap rate forecasts the yield after value-add work is complete. The gap between those two numbers is your execution risk. If you cannot close that gap operationally, your projected returns will not materialize.
How does cap rate expansion or compression affect investment returns?
Cap rate expansion means cap rates are rising. At constant NOI, rising cap rates reduce property values. This is exactly what happened across multifamily from 2022 through 2024, when rising interest rates pushed cap rates upward and compressed valuations across the sector. Investors who bought at 3.5% cap rates in 2021 found their assets repriced at 5.5% or higher by 2024, regardless of how well they managed the properties.
The relationship between cap rates and mortgage rates adds another layer. When a cap rate falls below the mortgage interest rate, negative leverage occurs. That means debt servicing reduces net investor returns rather than enhancing them. In a high-rate environment, this is not a theoretical risk. It is a real constraint on deal feasibility.
For exit modeling, the assumptions you use for your exit cap rate will make or break your projected IRR. Analysts model 50–100 basis points of cap rate expansion when stress-testing syndication returns given current market volatility. Core and core-plus deals target levered IRRs of 11%–14%. Value-add deals target 14%–18%. If your model only works at your going-in cap rate or tighter, the deal is fragile.
Here is what to check when reviewing any return projection:
Does the exit cap rate assumption reflect current market data, not 2021 comps?
Has the model been stress-tested with 50–100 basis points of cap rate expansion?
Does the projected NOI growth account for realistic rent growth, not optimistic lease-up assumptions?
Is the levered IRR still acceptable if the exit cap rate widens by 75 basis points?
Pro Tip: If a sponsor’s projected IRR collapses when you add 75 basis points to the exit cap rate, that is not a conservative underwrite. Ask for a revised model before committing capital.
What operational strategies connect revenue growth and asset value?
NOI quality is the key value driver because owners control operations. The cap rate is largely set by the market. NOI is set by your team. That asymmetry is where operators create or destroy value.
Here are the operational strategies that move NOI in a meaningful, repeatable way:
Rent optimization. Align pricing to market demand using a weekly review cadence. Pricing that sits stale for 30 days in a moving market is leaving revenue on the table. Clean data, proper setup, and human oversight matter more than the tool you use.
Ancillary income. Fees, amenity premiums, parking, storage, and package management revenue are often under-captured. Each of these flows directly to NOI with minimal incremental cost.
Expense recovery through RUBS and CAM reconciliations. Recovering under-billed expenses through RUBS or CAM reconciliations yields high-impact value creation with low operational effort. Fixing $40,000 per year of CAM under-billing at a 7% cap rate adds approximately $571,000 in property value. That is not a small adjustment.
Tax appeal strategies. Reducing your property tax assessment directly increases NOI. A successful appeal on a $500,000 annual tax bill can add millions in value at a 5% cap rate. This is one of the most overlooked levers in multifamily.
Lease expiration management. Clustering lease expirations in low-demand months creates pricing pressure and forces concessions. Spreading expirations across the calendar gives you pricing flexibility and reduces revenue volatility.
The connection between leasing strategy and revenue management is direct. When your leasing team and your pricing strategy are aligned, you capture more revenue per available unit. When they are not aligned, you get occupancy without yield.
Pro Tip: Run a CAM and RUBS audit before your next refinance or sale. Under-billed expenses are a common source of hidden value that shows up immediately in your NOI and your valuation.
Key takeaways
The multifamily cap rate revenue connection is the formula that translates every operational decision into asset value, making NOI the single most controllable driver of investment returns.
Point | Details |
NOI is the controllable variable | Every $10,000 in NOI improvement adds $142,857–$200,000 in value depending on cap rate. |
Cap rates stabilized in mid-5% range | Institutional core assets trade near 4.75% in 2026, with value-add assets 50–100bps wider. |
Stress-test your exit cap rate | Model 50–100 basis points of expansion to verify IRR holds under realistic market conditions. |
Expense recovery is high-impact | Fixing $40,000 in CAM under-billing at 7% cap adds approximately $571,000 in property value. |
Investment structure shapes net returns | Syndications, REITs, and direct ownership differ in tax treatment and cash distribution beyond cap rate. |
The part most investors skip over
I have reviewed a lot of underwriting packages over the years, and the pattern I see most often is this: investors spend significant time debating the going-in cap rate and almost no time auditing the NOI that feeds it. That is backwards.
The cap rate is largely a market input. You do not control it. What you control is the revenue your property generates and the expenses it carries. Investment structure also shapes after-tax returns in ways that cap rate math alone does not capture. Syndications, REITs, and direct ownership each distribute cash and tax benefits differently. Two deals with identical cap rates can produce very different net returns depending on how they are structured.
The other thing I push back on consistently is the exit cap rate assumption. I have seen models where the sponsor projects a tighter exit cap rate than the going-in rate, essentially betting that the market will compress further in their favor. That is not underwriting. That is optimism dressed up as analysis. Stress-test every exit assumption. If the deal only works in the best-case scenario, it is not a deal worth taking.
What actually moves the needle is clean, well-managed NOI. That means a revenue management setup that reflects your asset’s real market position, a leasing team that understands pricing intent, and a weekly review process that catches drift before it becomes a trend. Software does not create value. The strategy behind it does.
— Joani Schumaker
How the revenue method can strengthen your investment strategy
Understanding the cap rate and revenue relationship is one thing. Operationalizing it across a portfolio is another.

The Revenue Method works directly with apartment owners, operators, and asset managers to align pricing strategy, expense recovery, lease expiration management, and revenue management setup with the investment goals of each asset. The advisory work is independent, system-agnostic, and grounded in real operational experience across multifamily, build-to-rent, and student housing portfolios. If you want to improve NOI quality and understand exactly how your revenue strategy maps to asset value, explore the consulting services at The Revenue Method. The work starts with your numbers, not a software pitch.
FAQ
What is the multifamily cap rate formula?
The cap rate is calculated as net operating income divided by property value. This ratio directly links revenue performance to asset valuation in multifamily real estate.
How does NOI improvement affect property value?
Every dollar of NOI improvement multiplies property value by the inverse of the cap rate. At a 5% cap rate, a $10,000 NOI increase adds $200,000 in value.
What is a good cap rate for multifamily in 2026?
Multifamily cap rates stabilized in the mid-5% range in Q1 2026. Institutional core assets trade near 4.75%, while value-add and Sun Belt assets run 50–100 basis points wider.
What is the difference between going-in and stabilized cap rate?
The going-in cap rate reflects current performance, while the stabilized cap rate forecasts yield after value-add improvements are complete. The gap between the two represents execution risk.
What is negative leverage in multifamily investing?
Negative leverage occurs when a property’s cap rate falls below the mortgage interest rate. In that scenario, debt servicing reduces net investor returns rather than enhancing them.
Recommended


Comments