


How Occupancy Shapes Revenue in Multifamily Portfolios


Occupancy influences revenue, but it is not revenue itself. The real objective is portfolio NOI and RevPAU, and the single rule that follows from that is this: protect price integrity unless a defined decision framework — a lease-up timeline, a modeled NOI scenario, or a targeted tactical need — clearly shows that a temporary concession will increase net income. Filling units is not the goal. Filling them at the right rent, at the right time, is.
Healthy stabilized properties often run a natural vacancy rate around 4–6%, and 100% occupancy can actually signal that rents are undervalued. If your property is perpetually full, you may be leaving money on the table every single month.
Occupancy is a lagging indicator, not a leading one.
RevPAU and economic occupancy are stronger performance measures than raw fill rate.
The Revenue Method’s advisory work is built around this portfolio-level view, not unit-by-unit occupancy chasing.
Table of Contents
What metrics actually define the role of occupancy in revenue?
How occupancy moves the revenue needle — and what vacancy actually costs
Practical levers that move occupancy without damaging rent integrity
Common mistakes that signal you’re trading revenue for occupancy
Work with The Revenue Method on occupancy and pricing strategy
What metrics actually define the role of occupancy in revenue?
Understanding how occupancy affects income starts with using the right definitions. Physical occupancy and economic occupancy are not the same thing, and confusing them is one of the most common reporting errors in multifamily operations.
Metric | Formula | What It Tells You |
Physical Occupancy | Occupied Units ÷ Total Units | Fill rate only — says nothing about collections |
Economic Occupancy | Rent Collected ÷ Gross Potential Rent | Cash-flow strength; accounts for concessions and delinquency |
Effective Rent | Actual Rent Collected per Unit | Net rent after concessions are amortized |
RevPAU | Total Revenue ÷ Available Units | Combines rent and fill rate into one profitability lens |
Loss-to-Lease | Market Rent minus Effective Rent | Measures how far below market your rent roll sits |
Lease Trade-Out % | New Rent ÷ Prior Rent minus 1 | Tracks rent growth or erosion at each turn |
Portfolio NOI | Gross Revenue minus Operating Expenses | The bottom-line measure that drives asset value |
Economic occupancy better reflects cash-flow strength and investment risk than physical occupancy. A property can be 97% physically occupied and still collect well below its rent potential if concessions are deep or delinquency is high.
Track both metrics on a rolling 12-month basis alongside a weekly snapshot. The snapshot tells you where you are today; the rolling figure tells you the trend. RevPAU and Lease Trade-Out % are stronger performance metrics than raw occupancy because they combine rent and fill rate into a single profitability lens.
How occupancy moves the revenue needle — and what vacancy actually costs
The rent-occupancy relationship forms a curve. Pricing above market can lengthen vacancy days to the point where the annual revenue loss from extended vacancy exceeds the premium you captured on the rent. Here is a compact illustration:

Scenario | Monthly Rent | Vacancy Days | Annual Revenue | Turn Cost | Net Revenue |
Underpriced fill | — | 5 days | — | — | — |
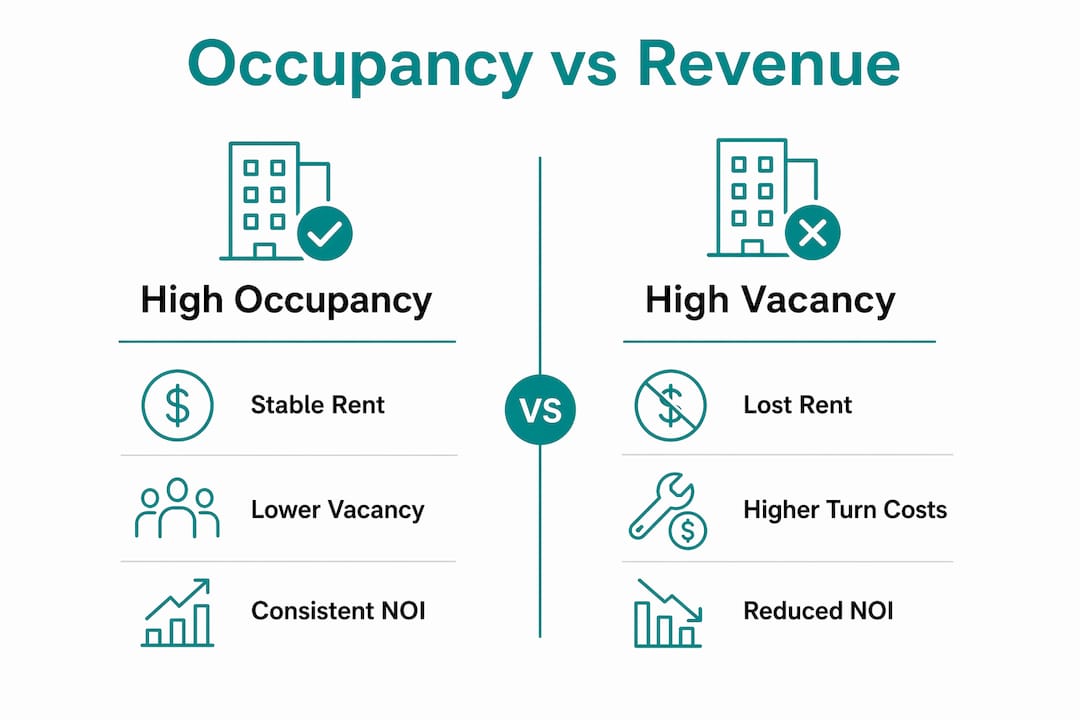
The premium-priced unit generates the lowest net revenue once vacancy carrying costs and turn expense are included. That is the inflection point operators miss when they focus on asking rent rather than annualized net income.
Turn costs typically include make-ready labor and materials, lost rent during the vacant period, leasing and marketing spend, and administrative time. Ignoring those inputs when modeling a rent increase is how operators convince themselves a higher ask is always better.
Pro Tip: Before raising rent on a slow-moving unit, model the full annualized net revenue at the new rate with realistic vacancy-day assumptions. The math often argues for a smaller increase than your instinct suggests.
When should you chase occupancy vs. protect rent?
The one-line rule: protect price integrity unless a defined trigger is present. Here is how to apply it.
Framework triggers that justify prioritizing occupancy:
Lease-up stage with a defined absorption timeline
Cash-flow emergency that threatens debt service
Concentrated lease expirations creating near-term vacancy risk
Submarket demand shock (new supply, employer departure)
Product misfit requiring a price correction to reposition
Diagnostics to run before lowering rent:
Check lead-to-tour conversion. If it is declining, the problem may be marketing, not price.
Review days-vacant distribution. Units sitting past 30 days need individual diagnosis.
Calculate loss-to-lease. If you are already below market, a cut makes the gap worse.
Model the NOI impact. Run a sensitivity at the proposed new rent with realistic fill assumptions.
Occupancy lags earlier funnel signals by 8–12 weeks. By the time occupancy drops, the root cause — softening inquiry volume or declining conversion — may have been developing for months. That is why pipeline diagnostics come before pricing decisions.
The shadow market hiding behind occupancy trends is often more telling than the occupancy number itself. A stable fill rate with deteriorating pipeline conversion is a warning sign, not a green light.
Practical levers that move occupancy without damaging rent integrity
Not every occupancy problem requires a rent cut. These levers address fill rate without permanently anchoring your comparables lower.
Structured concessions: Cap the value (one month free, not open-ended) and tie it to a sign date. A time-limited concession does not reset your effective rent the way a permanent reduction does.
Lease term incentives: Offer a modest discount for longer terms (13 or 14 months) to shift expirations away from soft seasons.
Renewal negotiation: A targeted renewal offer at a modest trade-out is almost always cheaper than a turn. Model the cost difference before defaulting to market.
Targeted marketing: Move-ready renters convert faster. Align leasing and marketing activity to the renter profile most likely to sign quickly, not just the broadest audience.
Amenity and ancillary pricing: Hidden revenue in your amenity setup can offset the need to cut base rent. Parking, storage, and package services are often underpriced.
Lease staging: Stagger expiration dates so you never face a cluster of simultaneous vacancies that forces reactive discounting.
For operational control, set approval thresholds so leasing teams cannot unilaterally trade rent for occupancy. Any concession above a defined value should require manager or asset manager sign-off. Align leasing incentives with RevPAU and trade-out percentage, not raw move-in count.
Portfolio-level optimization typically involves pricing 70–80% of units at market-clearing rates and holding 20–30% as premium units that accept longer vacancy to capture upside. That distribution reduces concentration risk while maximizing portfolio NOI.
How to model occupancy changes and protect valuation
Modeling is where operators turn intuition into defensible decisions. A basic rent-occupancy model needs these inputs: current asking rent, expected vacancy days at that rent, turn cost, concession value and amortization period, and a cap rate assumption for valuation sensitivity.
Modeling and data hygiene checklist:
Clean comp set with at least five comparable properties updated monthly
Lease-expiration visibility 90 days forward
Accurate make-ready and turn-cost inputs (not estimates from two years ago)
Consistent concession accounting (amortize, do not ignore)
Vacancy-day assumptions by unit type, not portfolio average
Cadence:
Review Type | Frequency | Owner |
Pipeline and vacancy review | Weekly | Leasing ops / revenue manager |
Comp set refresh | Monthly | Revenue manager |
Rent-occupancy curve re-run | Quarterly | Asset manager |
NOI sensitivity update | Quarterly | Asset manager |
A one-point drop in cap rate on a $10M asset adds roughly $100,000 in value for every $10,000 of additional NOI. That math makes the case for modeling before acting. Forecast accuracy depends on clean inputs more than sophisticated tools.
Pro Tip: Set up your revenue management system with accurate turn costs and concession amortization from day one. Garbage inputs produce garbage recommendations, regardless of the platform.
Common mistakes that signal you’re trading revenue for occupancy
These patterns show up repeatedly in portfolios that are chasing fill rate at the expense of NOI.
Cutting rent immediately when a unit sits vacant for two weeks, before running any pipeline diagnostics
Offering unlimited or open-ended concessions that depress effective rent for the full lease term
Ignoring loss-to-lease until it becomes a valuation problem at disposition
Failing to model turn costs when evaluating whether to hold or discount
Tying leasing team bonuses to move-in count rather than RevPAU or trade-out percentage
Red flags to watch:
Concessions rising month over month without a defined strategy behind them
Clustered lease expirations in a 30-day window with no mitigation plan
Average vacancy per turn exceeding your property’s historical baseline by more than a few days
A one-point drop in economic occupancy while physical occupancy holds steady (collections issue)
Pro Tip: If you spot these patterns, freeze unilateral discounting immediately, run an NOI sensitivity at current and proposed rents, and shift to targeted marketing before touching price. The best practices for leasing with revenue management start with diagnosis, not discounting.
How The Revenue Method applies these principles in practice
The process is straightforward, and the sequence matters.
Assess baseline metrics: Physical occupancy, economic occupancy, RevPAU, loss-to-lease, and turn costs — all pulled from clean, verified data.
Build a rent-occupancy model: Portfolio-level curve with vacancy-day assumptions, turn costs, and concession amortization.
Set portfolio-level pricing strategy: Define the market-clearing tranche and the premium tranche. Align leasing incentives accordingly.
Implement controls and cadence: Approval thresholds, weekly pipeline reviews, monthly comp refreshes, and quarterly model re-runs.
Monitor and adjust: Weekly review cadence with a single owner for each step.
The Revenue Method is system-agnostic and certified across revenue management platforms, which means the advisory work is not tied to any software vendor’s output. The deliverables operators receive during an engagement typically include a rent-occupancy model, a cadence plan, concession templates, and team training.
Property management decisions like these compound over time. The difference between a reactive operator and a disciplined one shows up most clearly at disposition.
Key Takeaways
Occupancy is an input to revenue, not the objective — protecting rent integrity and modeling NOI impact before acting is what separates disciplined operators from reactive ones.
Point | Details |
Economic occupancy over physical | Track rent collected vs. gross potential rent; physical fill rate alone misses collections risk. |
Model before you cut | Run a full annualized net revenue scenario with vacancy days and turn costs before reducing rent. |
Structured concessions only | Cap concessions by value and sign date to protect effective rent and future comparables. |
Weekly cadence with one owner | Assign a single owner to the pipeline review and hold it every week without exception. |
The Revenue Method | Provides system-agnostic advisory, rent-occupancy modeling, and cadence planning to protect NOI. |
The operator view on occupancy and revenue
Occupancy is not the enemy of revenue, but treating it as the primary goal is. The operators who protect long-term asset value are the ones who run the model first, hold the weekly review, and refuse to let a leasing team trade rent for a move-in count without a signed-off rationale. Software helps, but it does not make the call. Clean data, human oversight, and a clear decision framework do. That is the posture worth building, regardless of what platform you are running.
Work with The Revenue Method on occupancy and pricing strategy

If your team is making occupancy decisions without a rent-occupancy model, a defined concession policy, or a weekly review cadence, The Revenue Method can help you build that foundation. The typical first step is a diagnostic: baseline metrics, a model build, and a cadence plan your team can run independently. Services include advisory engagements, implementation support, team training, and lease-expiration analysis through ExpirationIQ. For operators who need ongoing fractional support or a full portfolio review, the advisory services page is the right starting point. Reach out for a diagnostic conversation and get a clear picture of where your occupancy decisions are helping or hurting your NOI.
Useful sources and further reading
Why Chasing Occupancy Can Cost You Revenue — Multi-Housing News: industry perspective on the long-term damage of rate-driven concessions and natural vacancy benchmarks.
Why “We’re Doing Fine” Is the Most Dangerous Leasing Signal — ApartmentList: explains why occupancy lags pipeline signals by 8–12 weeks and what to watch instead.
When Occupancy Isn’t the Whole Story — Break of Day Capital: detailed explanation of economic occupancy and its role in cash-flow analysis.
Rent vs. Occupancy Optimization — Botway Docs: numeric scenarios showing how maximum rent can reduce portfolio NOI.
Occupancy vs. Profit: Are You Chasing the Wrong Metric? — Atlas Global Advisors: rationale for RevPAU and trade-out % as primary KPIs.
Best Practices for Leasing with Revenue Management — The Revenue Method: operational controls and cadence recommendations for leasing teams.
Apartment Revenue Management Setup: A 2026 Guide — The Revenue Method: implementation checklist for data hygiene and system setup.
Multifamily Revenue Forecast Accuracy: 2026 Guide — The Revenue Method: forecasting techniques and accuracy checks for portfolio modeling.
Recommended


Comments