


What Is Revenue per Available Unit for Multifamily Owners


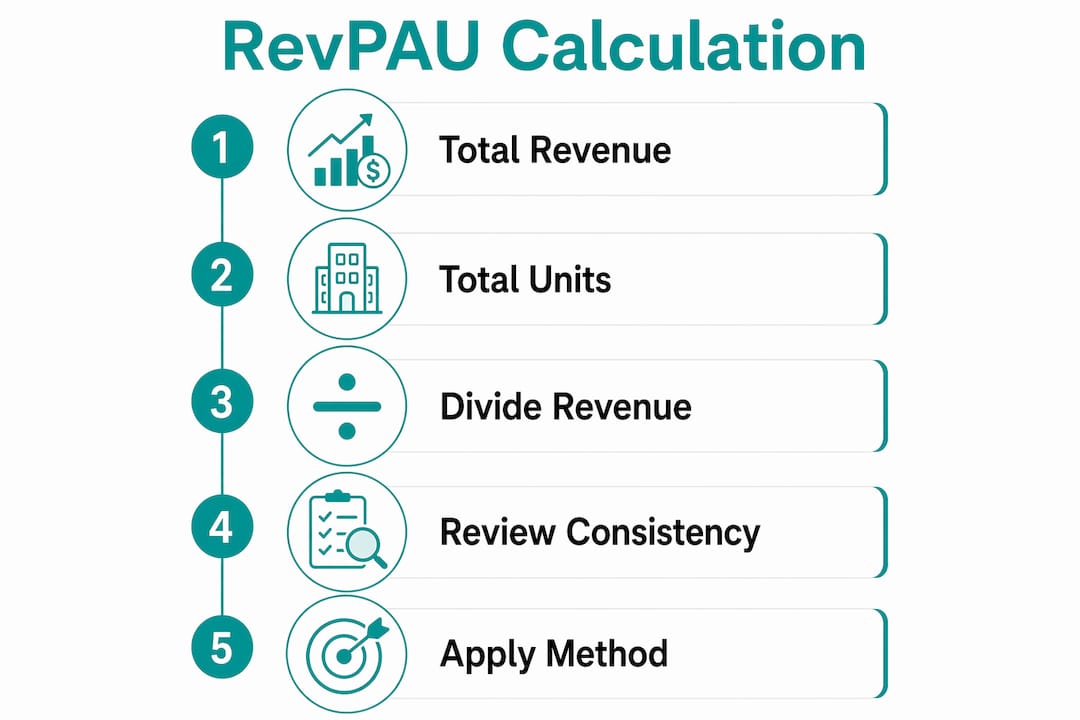
Revenue per available unit (RevPAU) is total revenue divided by total units, giving you a single, occupancy-aware figure that shows how efficiently your rent roll is converting into cash. Unlike average rent, which ignores vacancy entirely, RevPAU folds both pricing and occupancy into one number. The formula is straightforward:
RevPAU = Total Revenue ÷ Total Units

An alternate rent-only version works as a quick proxy: RevPAU (rent-only) = Average Rent × Occupancy Rate.
Quick example: a property collecting gross revenue equal to its average rent multiplied by occupancy produces a RevPAU illustrating the gap between asking rent and actual revenue collected. That $200 gap between asking rent and RevPAU is where vacancy and concessions live. Relevant benchmarks for this metric include net effective rent, Effective Gross Income (EGI), and space-normalized hospitality metrics like RevPAR and RevPAM.
RevPAU reflects what you actually collected per unit, not what you asked for
It works for any unit-based residential portfolio: conventional multifamily, build-to-rent, student housing
The Revenue Method uses RevPAU as a starting-line KPI before any pricing strategy conversation
Table of Contents
Why does RevPAU matter for multifamily operations?
Average rent tells you what leased residents pay. RevPAU tells you what every unit in the building is producing, occupied or not. That distinction changes how you read performance.
RevPAU combines pricing and occupancy into one top-line efficiency metric, which makes it useful across several operational decisions:
Pricing performance checks: A rising average rent paired with falling RevPAU signals that occupancy is eroding faster than rents are growing.
Lease-up monitoring: During absorption, RevPAU tracks whether concessions and velocity are producing acceptable revenue, not just filling units.
Portfolio benchmarking: When methodology is consistent across assets, RevPAU gives you an apples-to-apples comparison that occupancy alone cannot.
Investor communication: A single per-unit revenue figure is easier to explain than a matrix of occupancy, average rent, and concession burn.
RevPAU does have real limits. It tells you nothing about cost structure, debt service, or capital expenditures. It won’t show you NOI, cash-on-cash return, or whether a property is operationally profitable. Think of it as a top-line efficiency read, not a substitute for a full revenue management strategy.
How do you calculate RevPAU accurately?
The primary formula includes all revenue sources, net of concessions when you want a net-effective view:
RevPAU = (Gross Rent + Other Income − Concessions) ÷ Total Units
Follow these steps each reporting cycle:
Pull gross scheduled rent for all occupied units.
Add other income: pet fees, parking, storage, utility billing, amenity fees.
Subtract concessions: free rent, move-in specials, lease-up incentives.
Divide by total units in the building, not just occupied units.
Pro Tip: Use total units in the denominator every time. Switching between occupied units and total units mid-analysis is one of the most common methodology errors in multifamily reporting.
The rent-only proxy (Average Rent × Occupancy Rate) is useful for quick trend checks when you don’t have other income broken out, but it understates RevPAU for properties with meaningful ancillary revenue from amenity fees or pet programs.
In this example, average rent on occupied units is higher than RevPAU, reflecting vacancy drag and concession cost. That gap is the number worth managing.
What data pitfalls distort your RevPAU calculation?
Clean inputs produce a reliable metric. Messy inputs produce a number that looks fine on a dashboard but leads you to the wrong decision.
Common errors to watch for:
Gross vs. net rent confusion: Mixing gross scheduled rent with net effective rent across assets makes benchmarks meaningless.
Missing ancillary income: Excluding parking, storage, or pet revenue understates total revenue and makes RevPAU look lower than it is.
Wrong unit count: Using occupied units instead of total units inflates RevPAU and hides vacancy.
Timing mismatches: Counting move-in revenue in the wrong period (lease start vs. move-in date) creates month-to-month noise.
Double-counting concessions: Deducting a concession at both the lease level and the portfolio roll-up level deflates revenue artificially.
Pro Tip: Write your RevPAU methodology down. One page. Define which revenue fields are included, whether you use gross or net rent, and which unit count you use. Distribute it to every property team and your asset manager. Consistency in methodology is more important than the specific formula you choose.
Validation Check | What to Verify |
Revenue fields | Gross rent, other income categories, concessions all present |
Unit count | Total units, not occupied units |
Timing | Revenue and unit data from the same period |
Concession treatment | Deducted once, at the correct level |
Methodology consistency | Same formula applied across all assets |
For a deeper look at data governance issues that affect reporting accuracy, that’s a topic worth reviewing before you build any recurring dashboard.
How does RevPAU compare to average rent, RevPAM, NOI, and EGI?
Each metric answers a different question. Using the wrong one for a given decision is a common source of confusion.
Average rent: What occupied residents pay per unit. Ignores vacancy. Useful for pricing benchmarks, not performance.
RevPAU: What every unit produces, occupied or not. Combines pricing and occupancy into one figure.
RevPAM / RevPAF: Revenue per available square meter or square foot. Standard in hospitality and commercial real estate for space-normalized comparisons. Not appropriate for unit-based multifamily benchmarking.
EGI (Effective Gross Income): Total revenue minus vacancy loss and credit loss. Closer to RevPAU but typically used in underwriting, not operational reporting.
NOI: Revenue minus operating expenses. The right metric for profitability and asset valuation, but it requires cost data RevPAU does not.
Space-normalized KPIs like RevPAM are valuable in hotel and conference settings but require different data and interpretation than unit-based RevPAU. Don’t mix them when benchmarking multifamily assets.
Scenario | Best Metric |
Lease-up velocity and absorption | RevPAU |
Stabilized pricing performance | RevPAU + Average Rent |
Asset valuation and underwriting | NOI, EGI |
Amenity monetization tracking | RevPAU (total revenue version) |
Space utilization (hospitality/commercial) | RevPAM / RevPAF |
When should you use RevPAU as your primary KPI?
RevPAU works best in three specific operational contexts.
Lease-up: During absorption, RevPAU shows whether your concession strategy is producing acceptable revenue per unit or just filling beds. Pair it with absorption rate to understand velocity.
Stabilized assets: Track RevPAU month-over-month and year-over-year to catch pricing drift before it shows up in NOI. A flat RevPAU during a period of rent growth usually means occupancy is quietly slipping.
Portfolio benchmarking: When you apply the same methodology across properties, RevPAU gives you a clean comparison that accounts for both pricing and occupancy differences. Occupancy alone won’t tell you which asset is performing better if one has higher rents and lower occupancy than another.
Pair RevPAU with the right companion metric depending on your decision:
Pricing decision: RevPAU + net effective rent
Lease-up strategy: RevPAU + absorption rate + concession cost
Asset review: RevPAU + NOI + renewal rate
Investor reporting: RevPAU + EGI
RevPAU is not a substitute for cash flow analysis. It doesn’t show you whether a property is profitable, and it won’t flag deferred maintenance or capital needs. Use it as a top-line read, then go deeper with the metrics that match the decision.
How do you implement RevPAU reporting across your portfolio?
Getting RevPAU into a regular reporting cadence takes about three things: clean data fields, a defined methodology, and someone who owns the number each cycle.
Required data fields:
Gross scheduled rent by unit
Concessions by lease
Other income by category (parking, storage, pet fees, utility billing)
Total unit count
Occupied unit count and lease start dates
Recommended cadence:
Weekly: operational RevPAU check using rent-only proxy to catch pricing or occupancy shifts early
Monthly: full RevPAU calculation including other income and concessions, reported to ownership
Quarterly: benchmarking across assets, strategy review, and methodology audit
Roles:
Leasing team: validates unit counts and concession data at the property level
Revenue manager or analyst: runs the calculation, flags anomalies, maintains methodology documentation
Asset manager: reviews monthly RevPAU, connects it to lease expiration management and broader portfolio strategy
Pro Tip: Add RevPAU to your monthly owner report alongside occupancy and average rent. Three numbers on one line give a cleaner picture of top-line performance than any single metric alone.
For a full walkthrough of revenue management setup that supports this kind of reporting cadence, that’s a good next reference.
Two operator scenarios that show RevPAU in action
Scenario A: stabilized asset with consistent revenue and occupancy metrics illustrating pricing stability and concession effects.
Interpretation: RevPAU of $1,900 against 96% occupancy suggests pricing is holding. If RevPAU drops next month while occupancy stays flat, look at concession creep or a shift in unit mix.
Action points:
Compare RevPAU to the same month last year to identify seasonal drift
Review concession levels by floor plan to see where margin is leaking
Scenario B: lease-up asset with lower occupancy and concessions impacting total revenue and RevPAU.
Interpretation: RevPAU of $1,150 reflects both the occupancy gap and concession burn. The question isn’t whether RevPAU is low (it will be during lease-up) but whether it’s tracking toward your pro forma target at the expected absorption pace.
Action points:
Model the RevPAU trajectory at your target absorption rate to confirm you’re on pace
Evaluate whether concession spend is accelerating absorption or just reducing margin without velocity gains
Key Takeaways
RevPAU is the single most useful top-line efficiency metric for multifamily operators because it combines pricing and occupancy into one number that reflects what every unit actually produces.
Point | Details |
Core formula | RevPAU = Total Revenue ÷ Total Units; always use total units, not occupied units. |
Include all revenue | Add other income (parking, pet fees, storage) and subtract concessions for an accurate result. |
Methodology consistency | Define your formula in writing and apply it uniformly across every asset in your portfolio. |
Pair with other metrics | Use RevPAU alongside NOI, EGI, or renewal rate depending on the decision you’re making. |
The Revenue Method approach | The Revenue Method uses RevPAU as a starting-line KPI within a broader advisory and cadence framework. |
The metric is only as good as the discipline behind it
Most operators I work with already have the data to calculate RevPAU. What they’re missing is the consistency. One property uses gross rent, another uses net effective. One team counts occupied units, another counts total. By the time you try to benchmark across assets, you’re comparing apples to something that isn’t even fruit.
The operators who get the most out of RevPAU aren’t the ones with the most sophisticated software. They’re the ones who wrote down their methodology, trained their teams on it, and review the number every single month without exception. That discipline is what turns a metric into a management tool.
Start small: pick one asset, run the worked example from this article, and get your RevPAU for the last three months. Then ask yourself whether the trend matches what you thought was happening. The answer is usually instructive.
Ready to put RevPAU to work across your portfolio?
Knowing the formula is the starting line. Applying it consistently across a portfolio, with clean data, a defined methodology, and a reporting cadence that actually drives decisions, is where most operators need a second set of eyes.

The Revenue Method provides independent advisory support for multifamily owners and operators who want to build RevPAU and other KPIs into a real operational system, not just a dashboard number. Services include:
RevPAU methodology setup and documentation
Lease-up pricing audits and absorption strategy
Monthly reporting cadence design
Amenity pricing reviews to capture other income accurately
Training for leasing and revenue management teams
No software to buy. No vendor agenda. Just clear, operator-focused guidance built around your assets. Start the conversation with The Revenue Method today.
Useful sources
The following sources informed the definitions, formulas, and comparisons in this article:
How to Calculate Revenue per Available Unit — BubbleGum BI. Primary source for the RevPAU definition, formula variants, and methodology consistency guidance.
Top 10 Commercial Real Estate Revenue KPIs — Pulse RevOps. Used for the RevPAM/RevPAF distinction and the case for unit-based metrics in multifamily.
What is RevPAM? Definition and formula for hotels — SiteMinder. Reference for space-normalized metric definitions and their hospitality context.
RevPAM glossary entry — HSMAI Academy. Industry-standard definition of RevPAM for the metrics comparison section.
The Revenue Method — Internal resource for advisory services, implementation support, and RevPAU cadence frameworks.
Recommended

Comments